Changing the Time Range for Default Metric Charts
Set the bounds, or timestamps, of the metric data that you want for default metric charts. By default, charts show the last hour of metric data. Default metric charts are available on the Service Metrics page and under Metrics on resource details pages in the Console.
Note
The maximum time range returned for a query depends on the resolution. For more information about resolution, see Selecting a Nondefault Resolution for a Query.
For information about directly editing MQL expressions or changing queries by using the CLI or API, see Selecting a Nondefault Time Range for a Query.
-
Select a period of time from Quick Selects.
Example of chart for Last hour:

Example of chart for Last 6 hours:

-
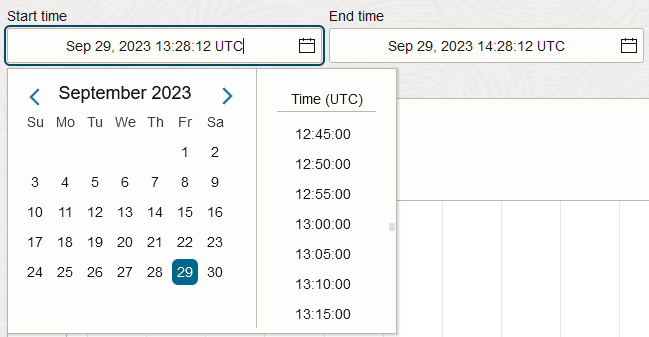
To specify the start or end of a period time, click in Start time or End time and then type a value.
You can also select the date and time from the provided calendar tool.